

- Available for Business tier in Connect AI only.
- Not available for Connect AI Embed.
-
Connect AI uses a range of static IP addresses to communicate with external data sources. To ensure that you can access your data, you must allow these static IP addresses in your data sources. The table below lists these IP addresses.
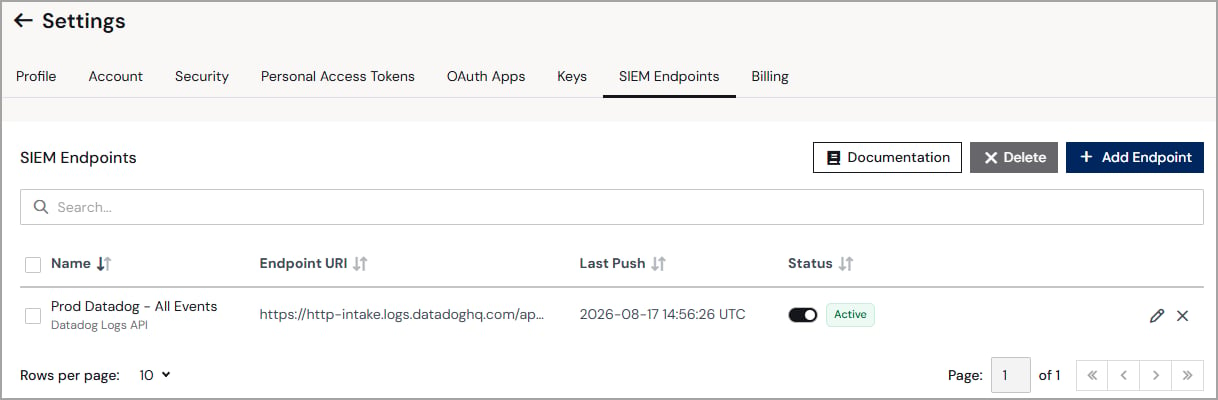
Only Administrators can view, modify, or delete SIEM endpoints.
Add a Datadog Logs API Endpoint
1
In the SIEM Endpoints tab, click + Add Endpoint. The Add Endpoint dialog appears.
2
Select Datadog Logs API.
3
Enter a user-defined Endpoint Name.
4
Under Configuration Settings, configure the following:
- Region–(optional) select the region for your Datadog account.
- DD-API-KEY–enter the Datadog API key used to authenticate the connection. Find your key in Datadog under Organization Settings > API Keys.
- Endpoint URL–autogenerated based on the selected region.
- Service Tag–(optional) enter a user-defined tag to identify the events forwarded to your Datadog account, such as audit-all-events. In Datadog, you can search by this tag.
5
Under Delivery Settings, configure the following:
- Event Scope–select which events are forwarded to the endpoint. Options include All Events. Coming soon: Support for specific events, such as Control Plane events.
- Batch Size (Events)–enter the maximum number of events to include in each batch.
- Batch Size (Time-based)–enter the maximum time interval (in seconds) before a batch is sent, even if the event limit has not been reached.
- Delayed Event Alert Threshold–enter the number of delayed events after which Connect AI sends an email alert to account administrators.
- Alert Recipient Email–enter the email address of the alert recipient, which can be a shared inbox. By default, this field is populated with your email address.
- GZIP Compression–toggle on or off to control whether event data is compressed before transmission.
6
Click Save. Connect AI tests the connection immediately. If the test succeeds, the endpoint is added to the list. If the test fails, an error message appears; check your configuration and try again.
Add a Splunk HEC Endpoint
Connect AI delivers query and audit log events to Splunk’s HTTP Event Collector (HEC) in OCSF (Open Cybersecurity Schema Framework) format. Setting up Splunk HEC involves three steps: creating an HEC token in Splunk, adding the endpoint in Connect AI, and installing the Splunk add-ons that let Splunk interpret OCSF events.Create an HEC Token in Splunk
- Connect AI verifies the TLS certificate your HEC endpoint presents on every request. The certificate must be issued by a public certificate authority and must match the hostname you enter. Self-signed certificates and certificates from an internal authority are refused.
- Splunk Cloud free trials cannot be used with Connect AI. A trial stack presents a self-signed default certificate, and the
http-inputs-address that carries a valid certificate is only provisioned for managed Splunk Cloud. To evaluate this integration, you need a managed Splunk Cloud stack or a self-hosted Splunk instance with a certificate from a public certificate authority.
1
If you want Connect AI events in a dedicated Splunk index, create that index in Splunk before you create the token. The token’s index is set at creation time from the list of existing indexes. Connect AI does not override the token’s index, so this is your only opportunity to control where events land without recreating the token.If you create a new index and later cannot find events, check that your Splunk role covers that index before assuming delivery failed.
2
In Splunk, go to Settings > Data Inputs > HTTP Event Collector and click New Token.
3
Complete the token setup wizard. When prompted, select the index you created, or accept the default.
4
On the confirmation page, copy the Token Value. Paste it into Connect AI as the HEC Token. Splunk does not display the token value again after you leave this page.
5
Note your collector address. The format differs by deployment type:
- Splunk Enterprise:
https://<your-splunk-host>:8088. The port8088is the default but can be changed by an administrator; it is never the same port as the Splunk web console. - Splunk Cloud Platform:
https://http-inputs-<your-stack>.splunkcloud.com:443. Thehttp-inputs-prefix is required. On Google Cloud and Azure stacks, the prefix ishttp-inputs.(with a dot instead of a hyphen).
/services/collector/event path; Connect AI appends it automatically.Add the Endpoint in Connect AI
1
In the SIEM Endpoints tab, click + Add Endpoint. The Add Endpoint dialog appears.
2
Select Splunk HEC.
3
Enter a user-defined Endpoint Name.
4
Under Configuration Settings, configure the following:
- HEC Endpoint URL–enter the collector address from your Splunk instance, including the port (for example, https://splunk.example.com:8088 for Splunk Enterprise, https://http-inputs-mystack.splunkcloud.com:443 for Splunk Cloud, or https://http-inputs.mystack.splunkcloud.com:443 for Splunk Cloud on Google Cloud or Azure). Connect AI appends the collector path automatically. You can also paste a full collector URL. To deliver to multiple indexers, enter up to ten addresses separated by commas.
- HEC Token–enter the token value from your Splunk HEC setup.
- Source–(optional) enter a label to identify events from this endpoint in Splunk. Delivered events carry this value as their Splunk source. If left blank, Connect AI uses the endpoint name.
- Sourcetype–read-only. Displays the fixed value
ocsf:cdata:connect, which you will enter in Splunk’s OCSF add-on. See Make Events Usable in Splunk for details.
5
Under Delivery Settings, configure the following:
- Event Scope–select which events are forwarded to the endpoint. Options include All Events. Coming soon: Support for specific events, such as Control Plane events.
- Batch Size (Events)–enter the maximum number of events to include in each batch.
- Batch Size (Time-based)–enter the maximum time interval (in seconds) before a batch is sent, even if the event limit has not been reached.
- Delayed Event Alert Threshold–enter the number of delayed events after which Connect AI sends an email alert to account administrators.
- Alert Recipient Email–enter the email address of the alert recipient, which can be a shared inbox. By default, this field is populated with your email address.
- GZIP Compression–toggle on or off to control whether event data is compressed before transmission.
6
Click Save. Connect AI validates the address on every save (HTTPS, reachable from the public internet, publicly trusted certificate). Token validation occurs when you enable the endpoint: enabling sends a single test event and refuses to save if Splunk rejects it, identifying the address that failed. A disabled endpoint can be saved without this test; errors surface when you switch it on. If you entered multiple indexer addresses, testing stops at the first failure. Fix the address named in the error and save again to check the rest.
The endpoint is now configured. To make events usable in Splunk dashboards and Enterprise Security detections, continue to the next section, Make Events Usable in Splunk. This is a required step.
Make Events Usable in Splunk
Without this step, Connect AI events are searchable text only: no dashboards, no Enterprise Security detections, and no correlation with other sources. Two Splunk add-ons and one configuration value teach Splunk how to interpret the OCSF events Connect AI sends. You must have Splunk administrator access for this step.1
Install the Splunk Common Information Model (CIM) Add-on from Splunkbase. The OCSF add-on maps events into CIM data model fields, so the CIM add-on must be installed first.
2
Install the Splunk Add-on for OCSF from Splunkbase.
3
In the OCSF add-on setup, enter the sourcetype that Connect AI sends:
ocsf:cdata:connect.Copy this value from the endpoint’s page in Connect AI; it is displayed there for this purpose. Connect AI always sends this sourcetype and it cannot be changed. The add-on matches against the ocsf:* pattern to normalize events. A different value stops normalization, leaving events that arrive but never populate dashboards or detections.4
Accelerate the following data models in Splunk so that Enterprise Security searches and dashboards include Connect AI events: All_Changes, Authentication, and Alerts.
If events arrive and are searchable but nothing appears in dashboards or detections, check the sourcetype configured in the previous step; this is the most common cause.
What Connect AI Sends
Connect AI sends query and audit log events in OCSF 1.3.0 format. Four OCSF classes are used:
All four classes normalize through the CIM and OCSF add-ons; no class requires special handling.
Splunk HEC Delivery Behavior
Events are delivered continuously as they are audited.- No filtering: Every query and audit log event your account generates is sent.
- OCSF only: OCSF is the only supported format.
- Pause and resume: Disabling an endpoint pauses delivery and holds its position. Re-enabling resumes from where it stopped. Events are held for a limited window while paused; a long pause can lose the oldest events.
- Delivery-failure alerts: If delivery starts failing, Connect AI sends a delivery-failure alert to the address configured on the endpoint.
- Event timestamps: Every event carries the time the audited action occurred, not the delivery time. A delayed or replayed batch still reports correctly in Splunk.
Edit a SIEM Endpoint
To edit a SIEM endpoint, click the edit icon in the endpoint list, make your changes, and click Save.Delete a SIEM Endpoint
To delete a SIEM endpoint that you no longer use, click the delete icon in the endpoint list. Click Confirm in the confirmation dialog that is displayed.Push History
Click the edit icon in the endpoint list to view the push history of an endpoint. The Push History section of the Edit SIEM Endpoint page displays delivery status information for each endpoint.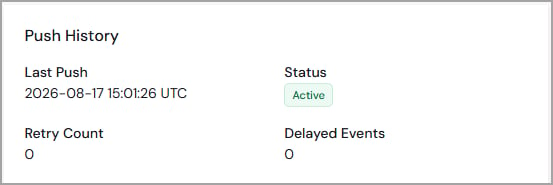
- Last Push–the date and time of the most recent event batch sent to the endpoint.
- Retry Count–the number of times Connect AI has retried delivery after a failed push.
-
Status–the current delivery status of the endpoint (Active, Failed, or Pushing). Click the status, such as Failed, to view details.
The failed status may be the result of expired credentials. Update your credentials and save. For Splunk HEC endpoints, re-enabling the endpoint sends a test event to confirm delivery.
- Delayed Events–the number of events that have not yet been delivered to the endpoint.
View Events in Your SIEM Platform
Datadog
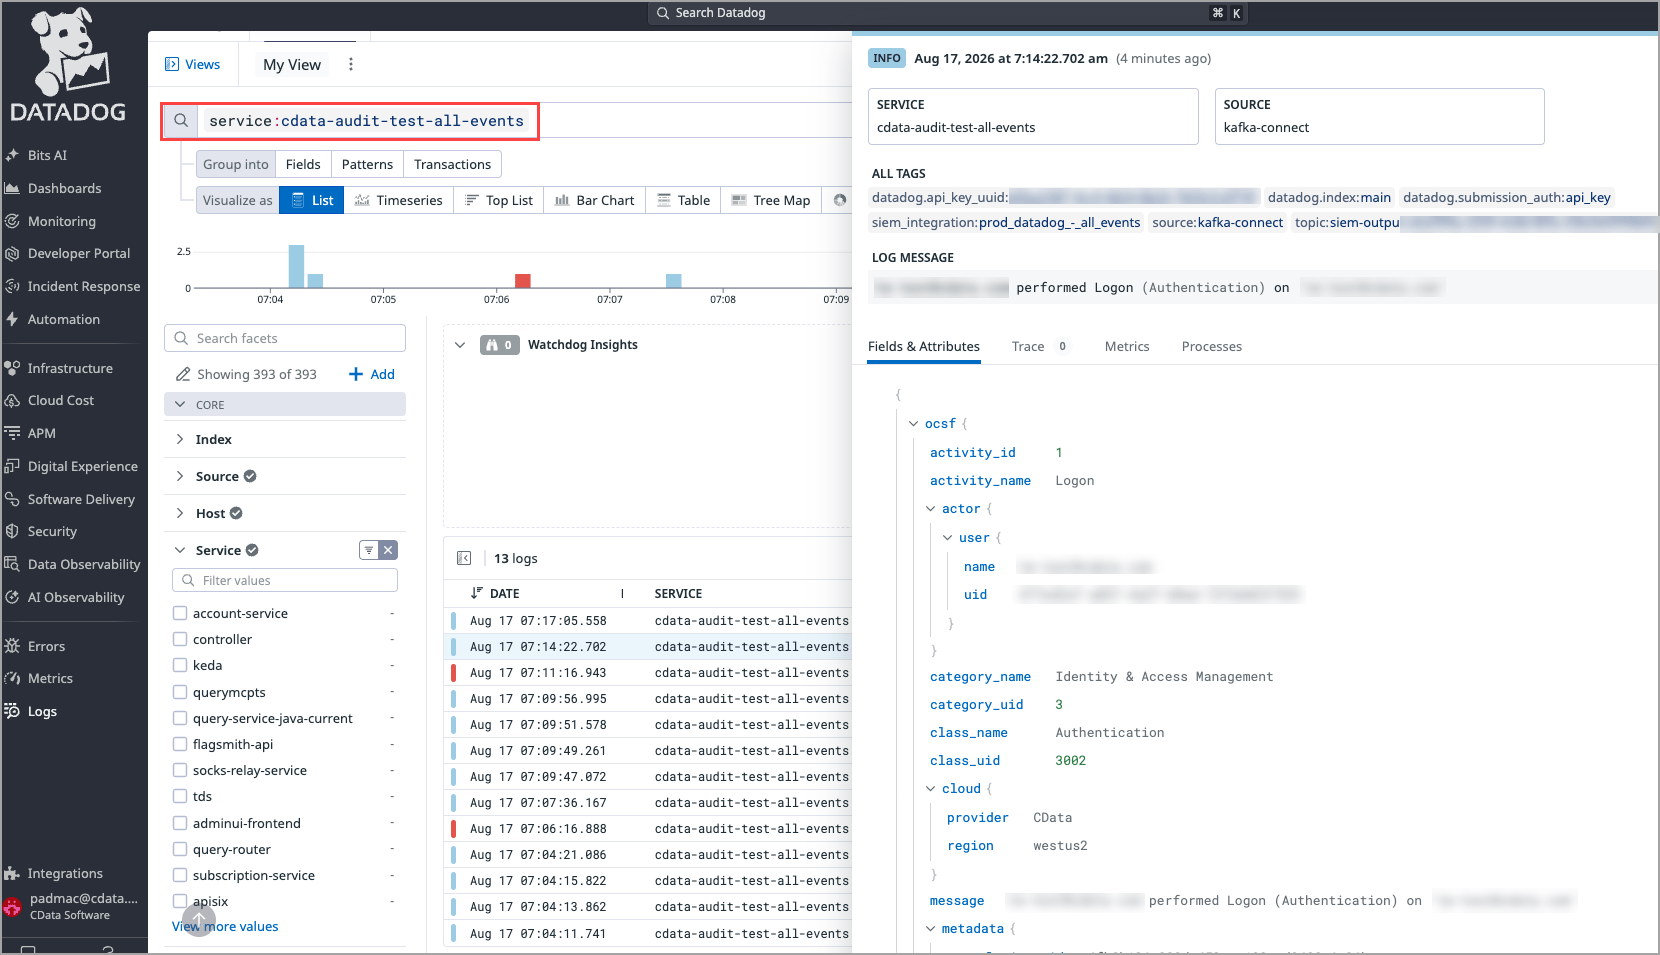
In Datadog, you can search using the Service Tag you entered on the SIEM Endpoint page. The following example displays all events under the tagcdata-audit-test-all-events:
Splunk
The amount of out-of-the-box content depends on which Splunk products you run:- Splunk Cloud or Splunk Enterprise: You can search events and build dashboards from events, but there is no prebuilt security content. The add-ons normalize the data; they do not add dashboards.
- Splunk Enterprise Security: Prebuilt SIEM content is available. Enterprise Security is a separately licensed product; the detections that run depend on which data model an event lands in.
- Authentication is where prebuilt content is richest. Sign-in activity, including failed service-account authentication, lands in the Authentication data model, which Enterprise Security ships substantial content against.
- Most Connect AI events are API Activity, which lands in
All_Changes. Enterprise Security’s prebuilt content for that data model is largely written for cloud infrastructure provisioning. Expect to write your own correlation searches for platform activity such as a connection being changed. The data is complete and normalized; the prebuilt detections are not aimed at it.