> ## Documentation Index
> Fetch the complete documentation index at: https://docs.cloud.cdata.com/llms.txt
> Use this file to discover all available pages before exploring further.
# Mode
> このページではMode をConnect AI の仮想SQL Server API に接続する手順の概要を示します。
## 前提条件
接続する前にまず以下を実行します。
* データソースをConnect AI アカウントに接続します。詳しくは、[Sources](/ja/Sources) を参照してください。
* [Settings](/ja/Settings#personal-access-tokens) ページでPersonal Access Token (PAT) を生成します。PAT をコピーし、認証時にパスワードとして使用します。
## Connect AI に接続する
Mode からConnect AI の仮想SQL Server API へのコネクションを確立するには以下の手順に従います。
Log in to Mode.
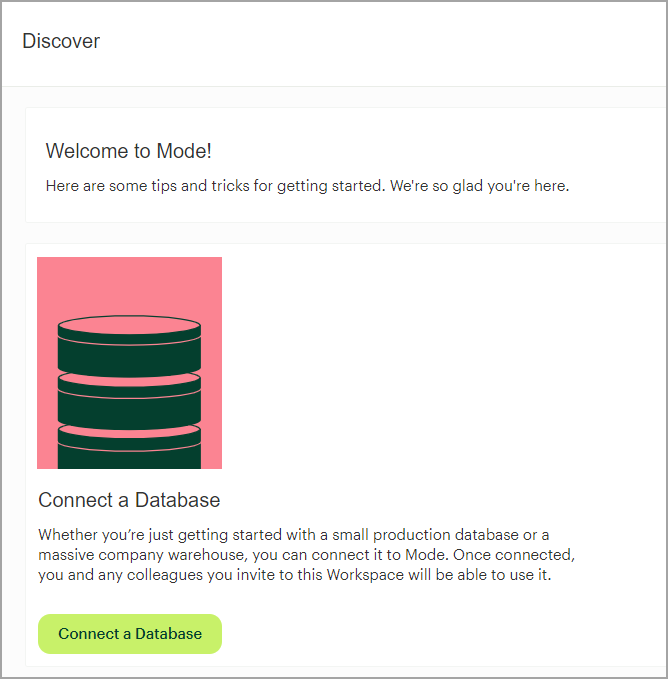
On the **Discover** page of Mode, click **Connect a Database**.
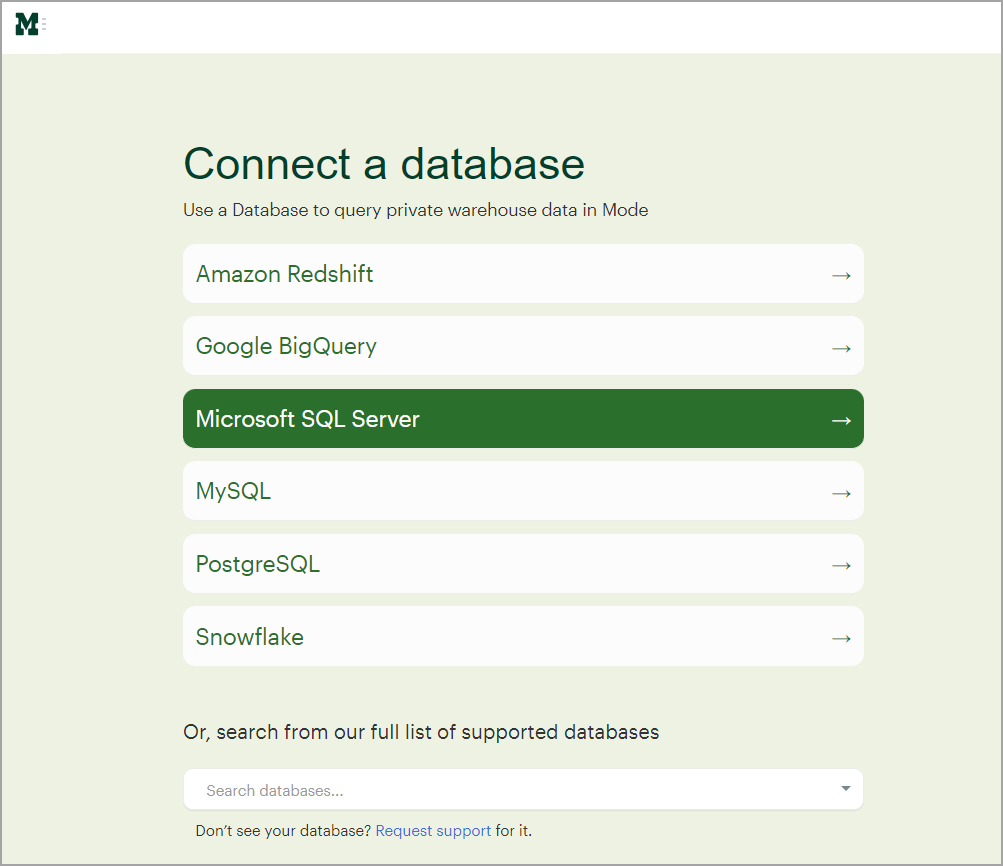
 On the next screen, select **Microsoft SQL Server**.
 Enter the following Microsoft SQL Server settings.
* **Display name**—enter the name of your connection for display purposes.
* **Host**—*tds.cdata.com*
* **Port**—*14333*
* **Database name**—接続したいConnect AI データソースのConnection Name を入力します。例:*Salesforce1*
* **Username**—Connect AI のユーザー名を入力します。ユーザー名は、Connect AI の画面の右上に表示されています。例:*[test@cdata.co.jp](mailto:test@cdata.co.jp)*
* **Password**—[Settings](/ja/Settings#personal-access-tokens) ページで生成したPAT を入力します。
Leave the rest of the connections settings at their default values unless you need to modify them.
Enter the following Microsoft SQL Server settings.
* **Display name**—enter the name of your connection for display purposes.
* **Host**—*tds.cdata.com*
* **Port**—*14333*
* **Database name**—接続したいConnect AI データソースのConnection Name を入力します。例:*Salesforce1*
* **Username**—Connect AI のユーザー名を入力します。ユーザー名は、Connect AI の画面の右上に表示されています。例:*[test@cdata.co.jp](mailto:test@cdata.co.jp)*
* **Password**—[Settings](/ja/Settings#personal-access-tokens) ページで生成したPAT を入力します。
Leave the rest of the connections settings at their default values unless you need to modify them.
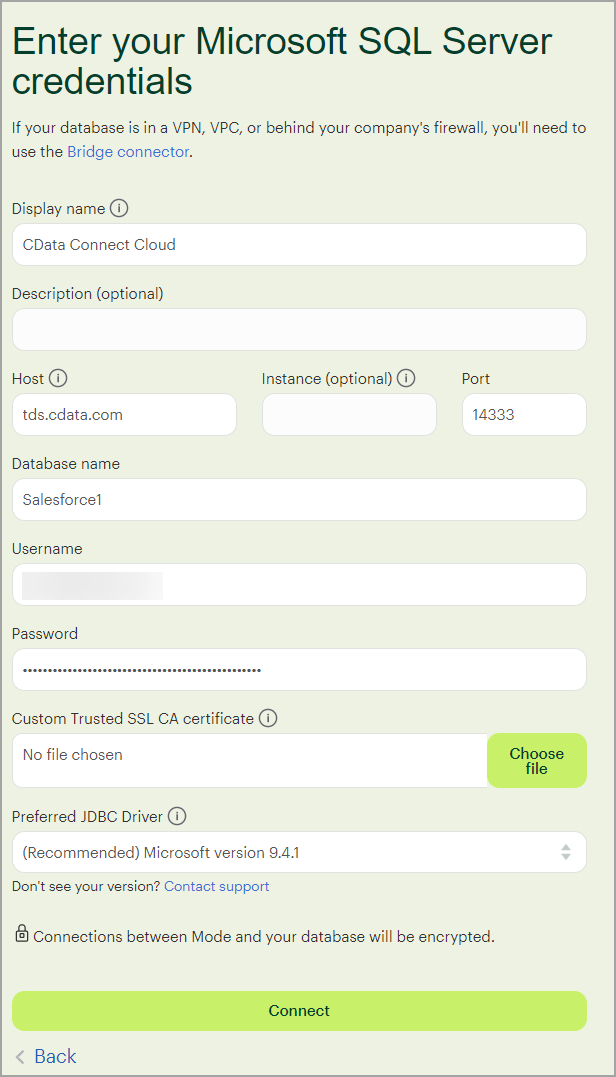 Click **Connect**. If the connection succeeds, a success message appears. Your connection is now available for use in Mode.
Repeat the steps above to connect to additional Connect AI sources, changing the **Database name** for each one.
You can now create a Mode visualization with the Connect AI data. Follow the steps below.
After your connection succeeds, click **New Report**. The SQL query text editor appears.
Click **Connect**. If the connection succeeds, a success message appears. Your connection is now available for use in Mode.
Repeat the steps above to connect to additional Connect AI sources, changing the **Database name** for each one.
You can now create a Mode visualization with the Connect AI data. Follow the steps below.
After your connection succeeds, click **New Report**. The SQL query text editor appears.
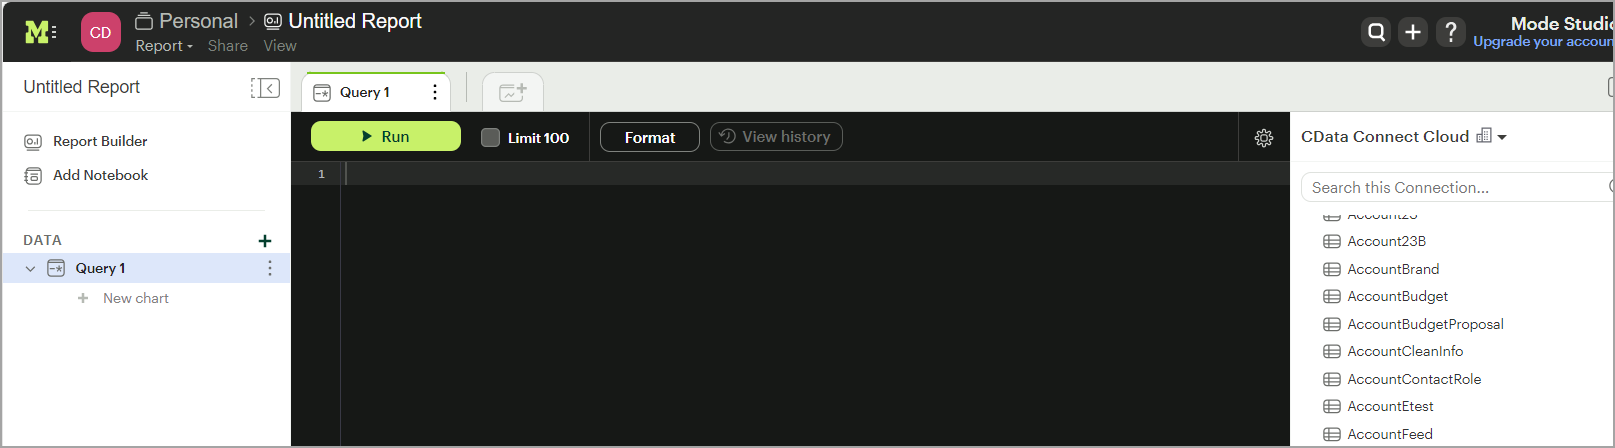 Enter a SQL query for your data, such as:
```sql theme={null}
SELECT * FROM [Sharepoint].[MyCustomList];
```
Click **Run** to run the query. The data appears below.
Click **+New chart** to create visualizations from the data.
Enter a SQL query for your data, such as:
```sql theme={null}
SELECT * FROM [Sharepoint].[MyCustomList];
```
Click **Run** to run the query. The data appears below.
Click **+New chart** to create visualizations from the data.